Docker オーケストレーションツール Nomad を使ってみる。
こんにちは k-jun です。今回は docker や podman などの container や Virtual Machine などのリソースを動的にスケールさせるオーケストレーションツール Nomad を使ってみようと思います。
https://github.com/hashicorp/nomad
立ち位置としては Kubernetes のようになるんでしょうか。Terraform と連携できたり、GUI もあるようなのでワクワクです。以下のリンクに従って構築してみます。
https://learn.hashicorp.com/collections/nomad/get-started
Install
https://learn.hashicorp.com/tutorials/nomad/get-started-install?in=nomad/get-started
$ brew tap hashicorp/tap
$ brew install hashicorp/tap/nomad
$ which nomad
/usr/local/bin/nomad
大丈夫そう。Cluster を起動してみます。
$ sudo nomad agent -dev -bind 0.0.0.0 -log-level INFO
==> No configuration files loaded
==> Starting Nomad agent...
==> Nomad agent configuration:

       Advertise Addrs: HTTP: 172.31.96.6:4646; RPC: 172.31.96.6:4647; Serf: 172.31.96.6:4648
            Bind Addrs: HTTP: 0.0.0.0:4646; RPC: 0.0.0.0:4647; Serf: 0.0.0.0:4648
                Client: true
             Log Level: INFO
                Region: global (DC: dc1)
                Server: true
               Version: 1.1.5

==> Nomad agent started! Log data will stream in below:

    2021-10-06T04:32:32.842+0900 [INFO]  agent: detected plugin: name=exec type=driver plugin_version=0.1.0
    2021-10-06T04:32:32.842+0900 [INFO]  agent: detected plugin: name=qemu type=driver plugin_version=0.1.0
    2021-10-06T04:32:32.842+0900 [INFO]  agent: detected plugin: name=java type=driver plugin_version=0.1.0
...
これも行けてそう。何かが起動したようです。別 Terminal から Node の状態を見てみます。
$ nomad node status
ID        DC   Name         Class   Drain  Eligibility  Status
bc09b3da  dc1  O-14731-MAC  <none>  false  eligible     ready

$ nomad server members
Name                Address      Port  Status  Leader  Protocol  Build  Datacenter  Region
O-14731-MAC.global  172.31.96.6  4648  alive   true    2         1.1.5  dc1         global
イマイチわからんが、Status が ready や alive だし大丈夫そう。この Cluster に対して job と呼ばれる単位のコンポーネントを定義し、与えていきます。
テンプレートを生成。
$ nomad job init
Example job file written to example.nomad
生成されたファイルのコメントを全て削除すると以下のような内容になっています。コメントを一通り読めばそれぞれのパラメーターの設定値は理解できますが、僕はせっかちなのでひとまず先に進みます。
パット見は redis が docker で起動して、port: 6379 で待ち構えるようになりそうですね。
job "example" {
  datacenters = ["dc1"]
  type = "service"
  update {
    max_parallel = 1
    min_healthy_time = "10s"
    healthy_deadline = "3m"
    progress_deadline = "10m"
    auto_revert = false
    canary = 0
  }
  migrate {
    max_parallel = 1
    health_check = "checks"
    min_healthy_time = "10s"
    healthy_deadline = "5m"
  }
  group "cache" {
    count = 1
    network {
      port "db" {
        to = 6379
      }
    }
    service {
      name = "redis-cache"
      tags = ["global", "cache"]
      port = "db"
    }

    restart {
      attempts = 2
      interval = "30m"
      delay = "15s"
      mode = "fail"
    }
    ephemeral_disk {
      size = 300
    }
    task "redis" {
      driver = "docker"
      config {
        image = "redis:3.2"
        ports = ["db"]
      }
      resources {
      }
    }
  }
}
job を実行して走らせてみます。
$ nomad job run example.nomad
==> 2021-10-06T04:44:14+09:00: Monitoring evaluation "9a75cb51"
    2021-10-06T04:44:14+09:00: Evaluation triggered by job "example"
==> 2021-10-06T04:44:15+09:00: Monitoring evaluation "9a75cb51"
    2021-10-06T04:44:15+09:00: Evaluation within deployment: "00e4f022"
    2021-10-06T04:44:15+09:00: Allocation "4f77c19b" created: node "bc09b3da", group "cache"
    2021-10-06T04:44:15+09:00: Evaluation status changed: "pending" -> "complete"
==> 2021-10-06T04:44:15+09:00: Evaluation "9a75cb51" finished with status "complete"
==> 2021-10-06T04:44:15+09:00: Monitoring deployment "00e4f022"
  ✓ Deployment "00e4f022" successful

    2021-10-06T04:44:36+09:00
    ID          = 00e4f022
    Job ID      = example
    Job Version = 0
    Status      = successful
    Description = Deployment completed successfully

    Deployed
    Task Group  Desired  Placed  Healthy  Unhealthy  Progress Deadline
    cache       1        1       1        0          2021-10-06T04:54:35+09:00
何やら動き出しましたね。ちなみに何度やっても同じ実行結果なので、冪等性がありそうです。Job の状態を見てみます。
$ nomad job status example
ID            = example
Name          = example
Submit Date   = 2021-10-06T04:44:14+09:00
Type          = service
Priority      = 50
Datacenters   = dc1
Namespace     = default
Status        = running
Periodic      = false
Parameterized = false

Summary
Task Group  Queued  Starting  Running  Failed  Complete  Lost
cache       0       0         1        0       0         0

Latest Deployment
ID          = 00e4f022
Status      = successful
Description = Deployment completed successfully

Deployed
Task Group  Desired  Placed  Healthy  Unhealthy  Progress Deadline
cache       1        1       1        0          2021-10-06T04:54:35+09:00

Allocations
ID        Node ID   Task Group  Version  Desired  Status   Created    Modified
4f77c19b  bc09b3da  cache       0        run      running  2m48s ago  2m27s ago
Allocation という項目がこの Job がどの Node で実行されているのかを示しているようです。これも状態を見るコマンドが存在するようなので見ていきます。
$ nomad alloc status 4f77c19b
ID                  = 4f77c19b-e49a-56d3-c5cd-764bd84c63a0
Eval ID             = 9a75cb51
Name                = example.cache[0]
Node ID             = bc09b3da
Node Name           = O-14731-MAC
Job ID              = example
Job Version         = 0
Client Status       = running
Client Description  = Tasks are running
Desired Status      = run
Desired Description = <none>
Created             = 4m48s ago
Modified            = 4m27s ago
Deployment ID       = 00e4f022
Deployment Health   = healthy

Allocation Addresses
Label  Dynamic  Address
*db    yes      127.0.0.1:31671 -> 6379

Task "redis" is "running"
Task Resources
CPU         Memory           Disk     Addresses
20/100 MHz  960 KiB/300 MiB  300 MiB

Task Events:
Started At     = 2021-10-05T19:44:25Z
Finished At    = N/A
Total Restarts = 0
Last Restart   = N/A

Recent Events:
Time                       Type        Description
2021-10-06T04:44:25+09:00  Started     Task started by client
2021-10-06T04:44:14+09:00  Driver      Downloading image
2021-10-06T04:44:14+09:00  Task Setup  Building Task Directory
2021-10-06T04:44:14+09:00  Received    Task received by client
おお、Port Forward っぽいものが見えましたね。一応 telnet で観測してみます。
$ telnet 127.0.0.1 31671
Trying 127.0.0.1...
Connected to localhost.
Job ごとの Log を観測するには以下のようなコマンドを使用します。
$ nomad alloc logs 4f77c19b
1:C 05 Oct 19:44:25.047 # Warning: no config file specified, using the default config. In order to specify a config file use redis-server /path/to/redis.conf
                _._
           _.-``__ ''-._
      _.-``    `.  `_.  ''-._           Redis 3.2.12 (00000000/0) 64 bit
  .-`` .-```.  ```\/    _.,_ ''-._
 (    '      ,       .-`  | `,    )     Running in standalone mode
 |`-._`-...-` __...-.``-._|'` _.-'|     Port: 6379
 |    `-._   `._    /     _.-'    |     PID: 1
  `-._    `-._  `-./  _.-'    _.-'
 |`-._`-._    `-.__.-'    _.-'_.-'|
 |    `-._`-._        _.-'_.-'    |           http://redis.io
  `-._    `-._`-.__.-'_.-'    _.-'
 |`-._`-._    `-.__.-'    _.-'_.-'|
 |    `-._`-._        _.-'_.-'    |
  `-._    `-._`-.__.-'_.-'    _.-'
      `-._    `-.__.-'    _.-'
          `-._        _.-'
              `-.__.-'

1:M 05 Oct 19:44:25.048 # WARNING: The TCP backlog setting of 511 cannot be enforced because /proc/sys/net/core/somaxconn is set to the lower value of 128.
1:M 05 Oct 19:44:25.048 # Server started, Redis version 3.2.12
1:M 05 Oct 19:44:25.048 # WARNING you have Transparent Huge Pages (THP) support enabled in your kernel. This will create latency and memory usage issues with Redis. To fix this issue run the command 'echo never > /sys/kernel/mm/transparent_hugepage/enabled' as root, and add it to your /etc/rc.local in order to retain the setting after a reboot. Redis must be restarted after THP is disabled.
1:M 05 Oct 19:44:25.048 * The server is now ready to accept connections on port 6379
いい感じですね。Kubernetes と同様に Container の起動、log の収集、Port Fowarding と同等のことが観測できています。Job の更新も試してみます。
$ cat example.nomad | grep count
    count = 3
$ nomad job plan example.nomad
+/- Job: "example"
+/- Task Group: "cache" (2 create, 1 in-place update)
  +/- Count: "1" => "3" (forces create)
      Task: "redis"

Scheduler dry-run:
- All tasks successfully allocated.

$ nomad job run example.nomad
$ nomad job status example
...
Allocations
ID        Node ID   Task Group  Version  Desired  Status   Created     Modified
9d06b72d  bc09b3da  cache       1        run      running  41s ago     30s ago
d05b931b  bc09b3da  cache       1        run      running  41s ago     29s ago
4f77c19b  bc09b3da  cache       1        run      running  14m56s ago  30s ago
Terraform チックな Dry-run も試せるようです。なかなか良さげですね。適用した結果も Allocations の箇所に ID が追加されているのできちんと起動してそうです。 Local PC 上で試しているので、Node ID が単一のものですが、Cluster を VM 上で構成すると、ここもいい感じに分散してくれそうです。
なお run command 実行時に、-check-index のパラメーターを付与することで 変更前の状態が plan command 実行時と変わらないことを確認してくれるようです。
これにより、複数人で作業しており plan command から run command を実行する間に他の作業者の run command が挟まっていないことを保証してくれるようです。
次に web interface を確認してみます。 localhost:4646/ui/jobs から確認。

この UI はすごいですね... 一発で状態把握ができそうです。
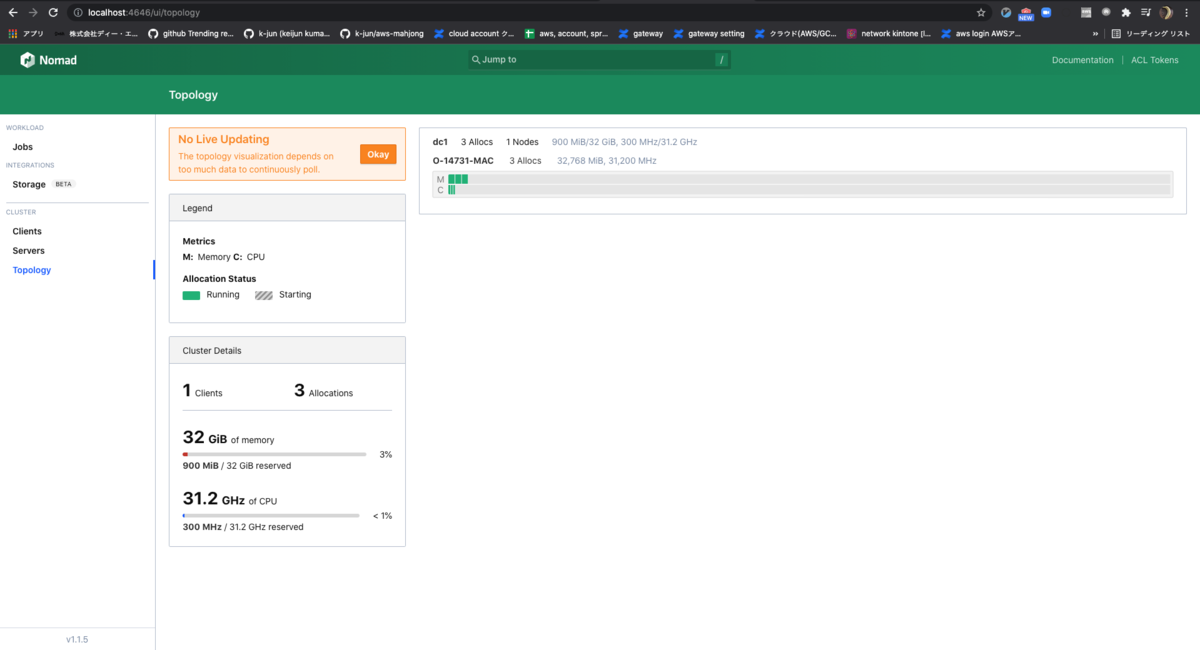
詳細設定なども見てみると、使用できる Memory 量などは Docker の設定を参照しているようですね。それにしてもこの UI は凄い。 Kubernetes はあまり詳しくないのですが、同等の UI を提供できるプラグインなどは存在するのでしょうか。
他の画面は以下のページを参照すると大体の雰囲気がつかめると思います。結構未来を感じますね...。
https://learn.hashicorp.com/tutorials/nomad/get-started-ui?in=nomad/get-started
それでは今回はこのへんで!